Where Do Our Carbon Emissions Come From Really?
A deep dive into our source of carbon emissions.
Have you ever wondered what’s the true scale of our carbon footprint? While we often hear about cars and factories pumping CO2 into the atmosphere, the reality of our carbon emissions is far more complex and pervasive. From the food on our plates to the digital services we use daily, nearly every aspect of modern life contributes to our carbon output. In this post, I'll dive deep into the surprising and often overlooked sources of carbon emissions, challenging common assumptions and shedding light on the true nature of the impact we have on our planet.
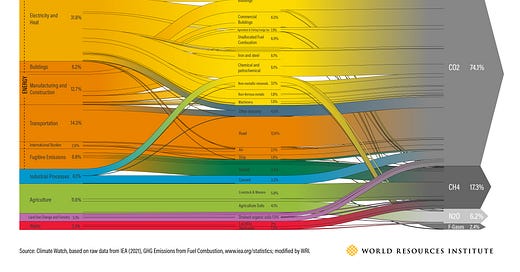
We’ll be using this wonderful graph from World Resources Institute which has collated the data from their Climate Watch platform. While their graph is interactive, I’ve added a static version of their graph below.
Now let’s try to understand this sankey graph once. There are 3 columns, and there’s the flow of a certain percentage of emissions from one column to the other.
The first column is the Sector, or the broad set of similar processes that contribute to GHG emissions in a similar manner - such as Energy : Electricity & Heat, Energy : Transportation, Agriculture, etc. The second column is the end-use/activity performed by humans that contributes to the GHG emissions. Like for eg - if you are burning fuel for generating electricity or heat, you can either do it at a residential building, a commercial building, or an industrial building - all are different end-use activities. The last column is the gas which is getting emitted, measured in CO2-equivalents. While CO2 has the dominant share with ~75% of the total output, Methane and Nitrous Oxide have significant shares of 17.3% and 6.2% respectively.
Non CO2 Gasses are converted to CO2-equivalents on the basis of their relative greenhouse potential (read more here) - over a 100 year timescale, one tonne of CH4 would generate 28 times the amount of warming as one tonne of CO2, while one tonne of N2O would generate 265 times the warming effect. So you take their mass of emissions (in tonnes) and you multiply that by the above numbers. However, there is a catch - all these gasses end up staying in the atmosphere for different timescales. CO2 can stay in the atmosphere for 100s, if not 1000s of years. While CH4 stays in the atmosphere for just 12 years (on avg), & N2O stays in the atmosphere for 121 years (again, on avg). They also have different biological cycles and interactions which are beyond the scope of this article - however, the important thing for us to take away is that they also have significant heating effect, and luckily for us, scientists have done the hard work of measuring their emissions in CO2 equivalents, which is what we will use in all the calculations.
Sectoral Emissions
Now it’s easy to see that the same sector of emissions can be made with different end use activities, but the same end use activity can have different source of emissions. Like for eg, Iron & Steel can have emissions from the Electricity usage at the plant, but also from the very nature of the manufacturing process used to create the Steel in the first place.
Let’s dive deep into the sectoral emissions. For the purpose of this article, we will focus only on the Energy related emissions - which correspond to the bulk of the emissions - around 75.6%.
I’ve created a pie chart of the sector wise emissions. All the energy related emissions are marked with an (E) label. It’s no surprise that Electricity & Heat leads the way with a mammoth 33% share. Transportation comes in next at 16.9% - the 14.2% share corresponds to intra-country or national transportation, while International Bunker (2.7%) corresponds to international transportation, both air and sea (we will talk about transportation in detail later). The combined total of electricity & heat and transportation is 50% of our total emissions, so it makes sense why we focused on decarbonising them first. The data does throw some interesting surprises though. Agriculture, whose GHG emissions end up getting much lesser attention, is in the similar ballpark, 11.6%! We also don’t associate waste with GHG emissions, but it contributes a decent 3.3% to our total emissions.
Transportation
(You can read about transportation emissions here in more detail)

Credit to OWID for this great graphic which breaks down transport emissions by end usage. As you can see, passenger road transportation corresponds only to ~45% of total transport emissions. Freight traffic has a high share of ~30%, while aviation and shipping have a combined share of ~23%.
Changing All Passenger Vehicles to EVs Wouldn’t Change Things So Much
The interesting thing is that currently, we only have the technology to decarbonise passenger road transportation. The batteries in the market currently have an energy density of 250-300 Wh/kg, and that is just not enough for creating electric trucks and lorries. Given the mass of freight they carry, and the long distances they travel (at least in US & Europe), much higher densities in the range of 500-750 Wh/kg would be required. Yes, there are Tesla Semis plying, but the heavy duty freight trucks in the US travel 800-1000km per day - to cover that distance in 1 go would require batteries in the range of 800-1000 Wh/kg, not possible with current technology.

Battery density requirements for electric planes is even higher. As you can see from the above graph, you would need battery densities in the range of 1500 Wh/kg to decarbonise all kinds of aviation. And according to this projection from Cleantechnica for electric ships, even at battery densities of a whopping 2600 Wh/kg, the ship range will be 1200 nautical miles (2222km) - enough for only inland routes and short-sea routes. We would need to make heavy investments in frontier technologies like solid-state batteries to reach such densities - which seems very unlikely in the near future.
(TBH, the technology for decarbonising ships already exists - we have nuclear powered aircraft carriers in service for the major military powers. However, it can 1) be very expensive and not at all economical, 2) due to geopolitical reasons, the big powers may not want civilian cargo ships to be nuclear powered, lest bad actors can reverse engineer the technology and create nuclear powered military ships)
Given this context, if all the passenger road transport vehicles were replaced with EVs, and the source of all the electricity becomes 100% clean, and all the emissions from battery manufacturing are offset (by something like carbon capture), only 7.6% of the global GHG emissions will be reduced. ONLY 7.6%!! That just tells you how complex an issue climate change is, and what gargantuan effort will be required in so many directions to decarbonise our economy.
Electricity & Heat
Most Electricity Consumption is by Manufacturing and Industry
This is how emissions from Electricity & Heat are broken down by End-Use Activity. Industrial buildings take the lions’ share here, at nearly 12.2% of TOTAL emissions! Nearly a 1/3rd of electricity emissions are from industrial usage. In fact, residential and commercial buildings emissions combined (11.8%) is less than industrial buildings’ emissions! You can see this in China’s electricity consumption data as well. In 2023 in China, nearly 2/3rd of ALL electricity was used by the secondary sector - total electricity consumption was 9.22 T kWh (or 9.22 × 10¹² units), while that of the secondary industry was 6.07 T kWh. The interesting thing is - a significant chunk of world GDP (62% is the share of services in global GDP) is generated in commercial buildings, but their contribution to global emissions is much lower, at 4.8%!! We are already in a world where GDP growth & CO2 emissions are decoupled, which makes incentivising decarbonisation efforts that much tricky.

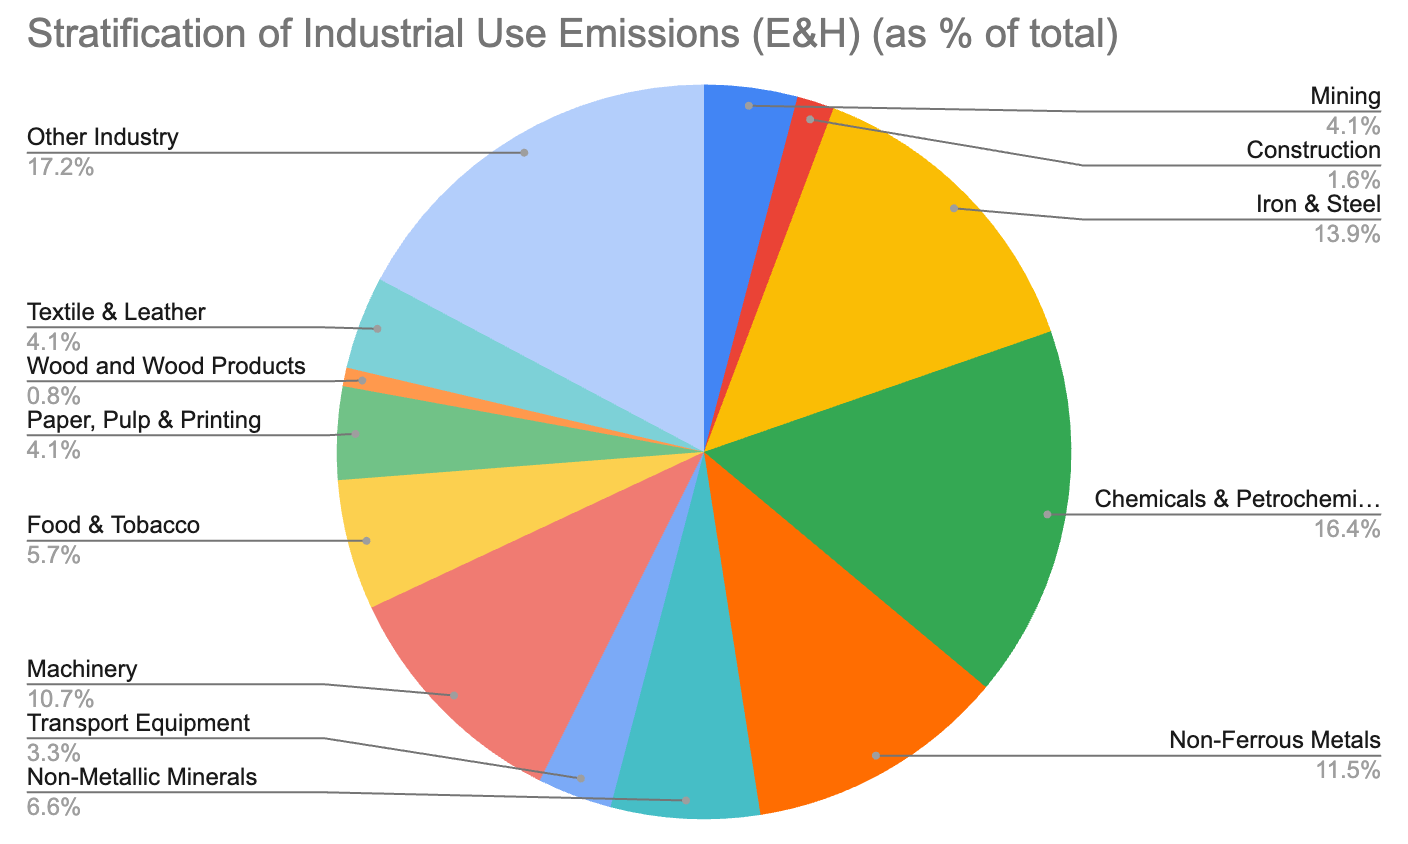
Above chart stratifies the industrial use emissions by the specific industry - here too, it’s not as if there’s a particular industry that’s dominating the GHG emissions, adding to the complexity of decarbonisation.
Now, what percentage of global electricity was generated from renewable sources? In 2022, about ~28,500 TWh of electricity was generated globally. Out of that - roughly ~17,400 TWh (60%) was generated from coal, gas & oil, & ~11,142 TWh (40%) was generated from renewables (majority hydro and nuclear!). Great, so 40% of global electricity is generated from renewables. However, the share should be much higher given that the technology to decarbonise electricity generation has existed for decades - civilian nuclear power. No, we will not be able decarbonise the world with solar, wind and batteries, and that’s a debate that is completely off topic (also I love how the solar and battery bros completely gloss over the CO2 emissions due to silicon and lithium mining lol). But I will mention one thing - as we saw above, the majority of global electricity consumption is by industry. Not only is their energy requirement (in Js) high, but power requirement is also very high - sometimes in the MWs range. That’s why a lot of factories are close to energy sources - say Iron & Steel plants in Odisha (close to coal plants), or manufacturing at the foothills of Himalayas (close to hydro plants). Solar and Wind are just not energy dense and reliable enough to cater to those energy needs. Solar rich areas are deserts and wind rich areas are offshore in the sea - and it’s not possible to do any kind of manufacturing there.
Buildings
When I first saw the buildings emissions category - I was like so confused about what kind of activities contribute to these emissions. Like do these correspond the concrete used in the construction of the house - no, that corresponds to non-Energy Industrial Processes section. Then do these correspond to the electricity consumption at buildings? No, again, that is something we covered in the above section.
Buildings related emissions include all emissions from energy generation/usage activities that happen onsite. Note - this doesn’t include consumption of electricity that has been generated in a power grid elsewhere. Examples include -
Using natural gas/firewood for heating the house (in temperate countries)
Using piped gas or gas cylinders for cooking food
Leakage of refrigerants from ACs and refrigerators (very uncommon now)
Usage of diesel generators at home as power backup (very common here in India)
While all these examples are helpful, it was still very difficult to wrap my head around how building related emissions correspond to nearly 6.2% of all global CO2 emissions - that’s nearly 3.1Gt CO2e!! Then I looked at the data, and that shocked me.
Heating Buildings is the Primary Cause of Buildings Related Emissions

IEA has compiled a whole host of data on CO2 emissions & energy consumption from heating (& everything else really). According to their data, heating activities in buildings contributed to direct emissions worth nearly 2.44 Gt CO2e!! That’s nearly 80% of all the emissions from buildings! Sitting here in India, it is difficult to visualise these emissions, given that here nearly everyone uses electric geysers for water heating and electric heaters for space heating. But then again - our heating requirements are far lower than that of temperate countries.
Even at a global level, only 14.3% of global heating demand is met with electricity. Out of the remaining 85.7%, only 11% of energy needs are met with direct onsite usage of renewables - the rest 75% of all heating demand is met through dirty sources.
Now coming to decarbonisation - the technology to decarbonise heating exists - just use electric heaters like electric radiators, electric baseboards, oil heaters, etc! The most important among them are heat pumps.
This video explains how heat pumps work very succinctly. The good thing about heat pumps is that they are way more energy efficient than other electric heaters, AND they can be used for cooling! Most houses in Europe don’t have air conditioners and they use natural gas boilers for heating - so heat pumps are ideal for them. Also, with the extreme effects of climate change getting worse, the number of places in the world that will require both heating and cooling solutions will drastically increase. Currently, only 10% of space heating needs globally were met by heat pumps in 2021, but the pace of installation is growing rapidly with sales at record levels. So yeah - 100% of building carbon emissions can be eliminated - the technology to decarbonise buildings exists, it’s about moving the policy and market levers to ensure faster global adoption.
Manufacturing & Construction
Incredible amount of CO2 is released as a by product of mining and manufacturing goods - this is different from the CO2 emitted from consuming electricity for the manufacturing. How much? Well they account for 12.7% of the TOTAL GHG emissions, that is 6.35 GtCO2e. That’s nearly a third of all electricity related emissions, and nearly as much as ALL transport emissions. What’s the process that cause these emissions? A small recap of 9th grade science will tell us how -

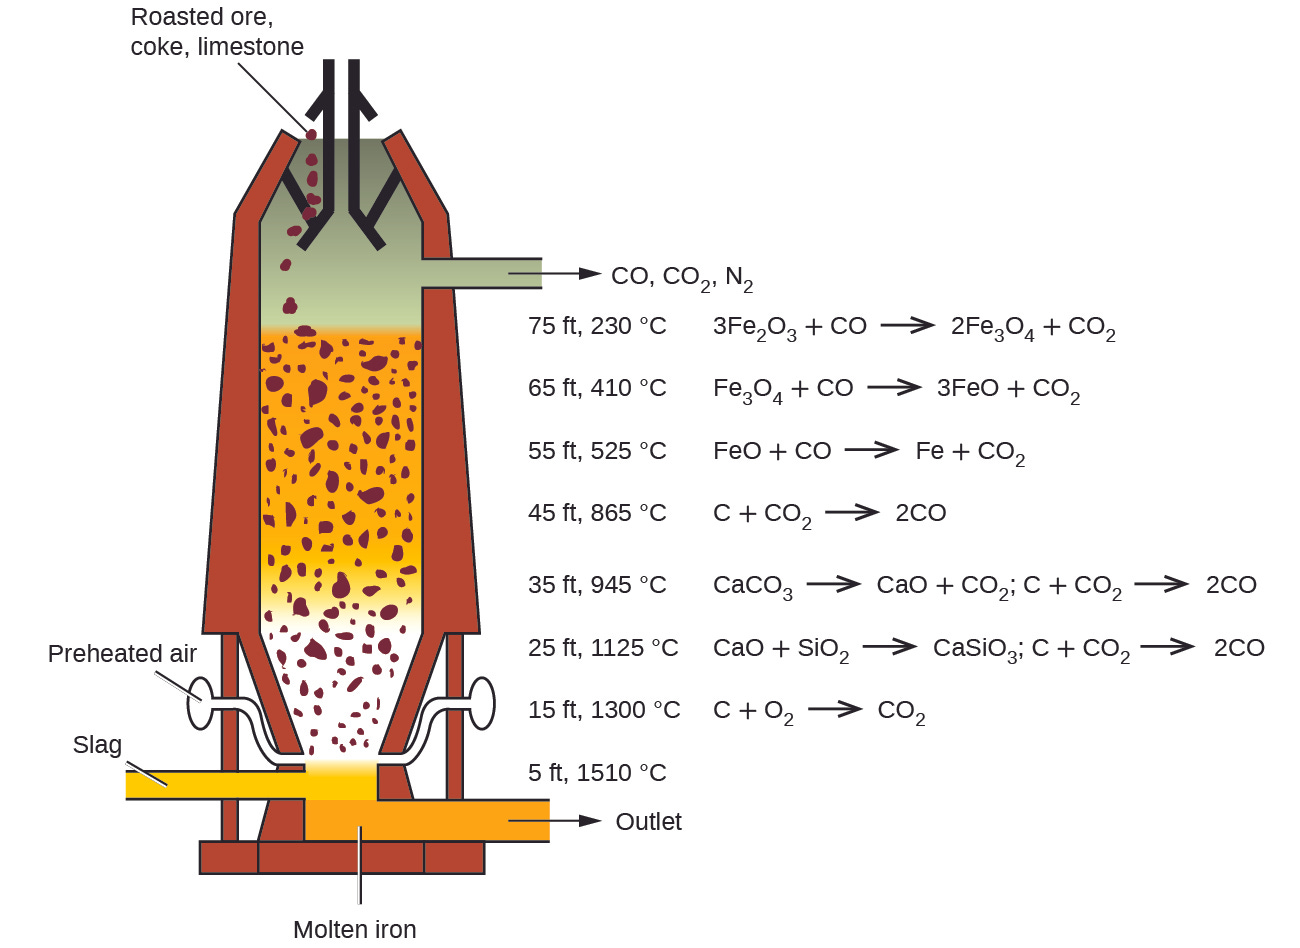
The most important ingredients in the manufacturing of steel are iron ore, coking coal and limestone. They are all mixed in a blast furnace and heated up to 2000°C. Within the iron ore, Iron is present in the form of oxides (Fe2O3) and the important part of the process is to strip away the oxygen and all the impurities in the ore. That is done by the coking coal - not only does it act as a fuel (to increase the temperature), it also reacts with all the oxygen in the ore to produce CO & CO2, thereby reducing the iron. The limestone (CaCO3) on the other hand, removes the impurities in the ore by reacting with them to product hybrid calcium compounds (the above diagram gives us an example of such a reaction between CaCO3 and SiO2, the most abundant mineral on earth). This process also reduces the carbonate and releases CO2.
Manufacturing Emissions are Really Hard to Decarbonise
Why did we do a recap of the iron and steel manufacturing process? To understand how important metallic reduction is to all our mining & manufacturing processes for metals. Remember, nearly all metals in the Earths crust exist as oxides (46% of the Earth’s crust is oxygen!) If we want any metal in its elemental, non-oxidised form, 1) we need to pump in an incredible amount of energy (because we are changing the metal from a low-energy to high-energy state), and 2) we need a reducer that strips apart the oxygen from the metal oxide and absorbs it. And there is no reducer that is as readily available, cost-effective and versatile as coal. That’s why coal is used in the manufacturing of nearly EVERY metal - iron, aluminium, copper, etc. It’s also used in the manufacturing of non-metals like Silicon (now probably the most important element for our world after Iron). I’m not even sure if people have come up with a CO2 neutral iron & steel manufacturing process (that is scalable and cost-effective).
It’s no wonder that when you look at emissions from manufacturing (non-electricity related), more than 50% of the emissions come from manufacturing of Iron & Steel, non-ferrous metals & non-metallic minerals, like Si!! A significant amount of emissions come from manufacturing of chemicals and petrochemicals as well (like the fractional distillation process).
In my opinion, this sector is probably the hardest to decarbonise - given how CO2 emissions are so intrinsically tied to the manufacturing process. For so many of these processes, no one would have come up with a emission neutral alternative, and even if they have, scaling that and making it cost-competitive with the current processes will be no mean feat. So I expect CO2 emissions from this sector to continue on for a while.
Fugitive Emissions
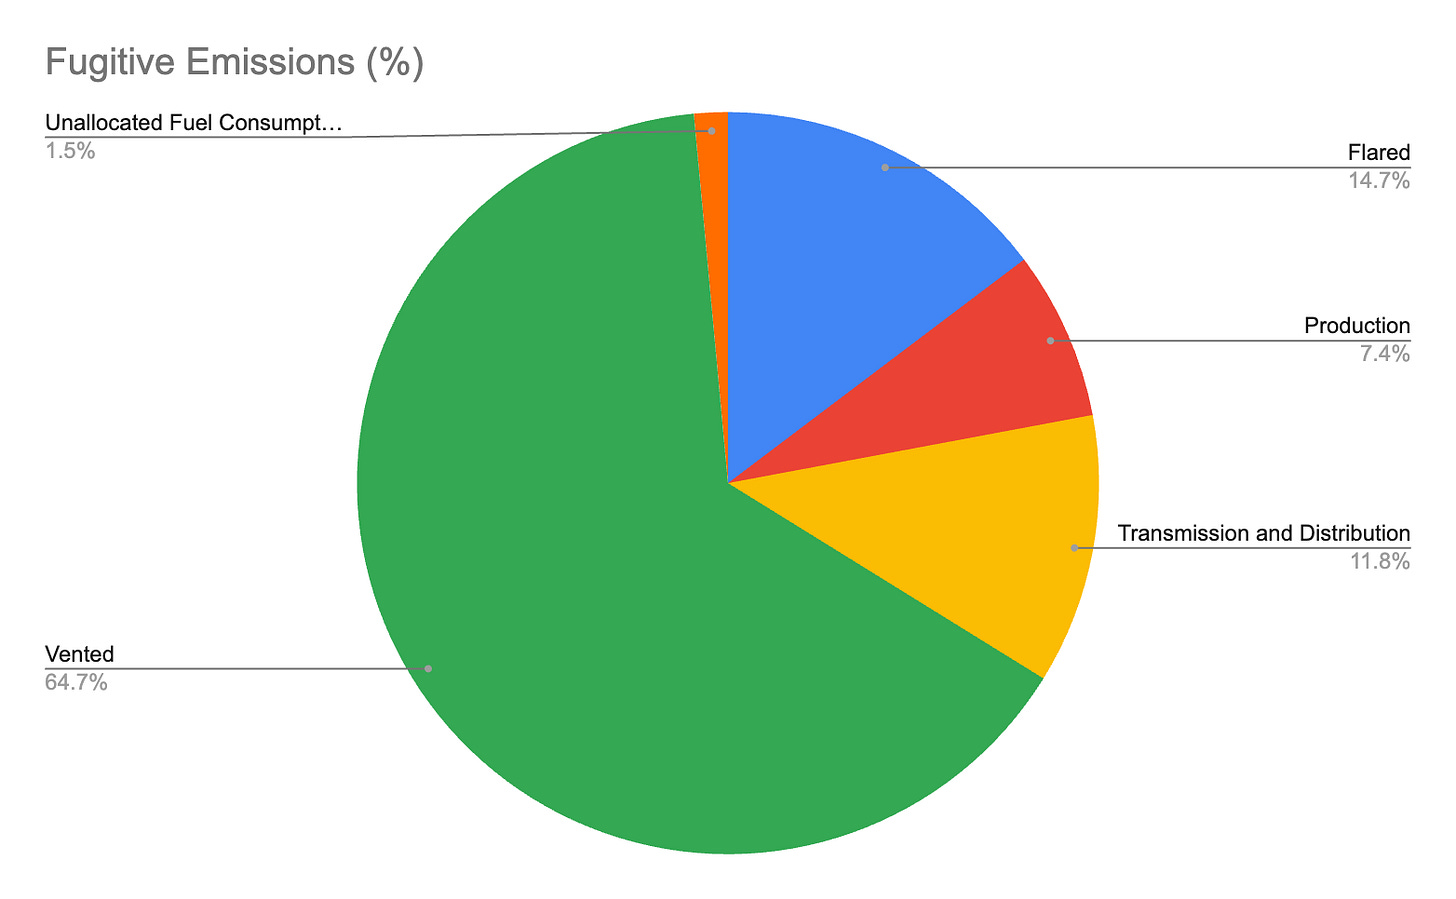
Fugitive Emissions are emissions from leaks, spills, or any other such inefficiencies occurring during the process of extracting oil and gas. Do you know what share they have in the total emissions? 6.8%!!! A whopping total of 3.4 GtCO2e emitted per year!! That’s equivalent to nearly ALL the emissions from electricity usage at residential buildings, or nearly 90% of the emissions from ALL passenger vehicles (cars, 2 wheelers, buses)!! It’s a crime against humanity that these emissions still continue to happen, and no one takes accountability for them. All countries should enforce stringent standards, measure the leaks of oil & gas thoroughly, and put significant penalties on oil & gas companies on these leaks.
The above graph breaks down the fugitive emissions by the exact type. What exactly are venting and flaring, which make up nearly 80% of all the fugitive emissions? This article gives a very good summary.
Gas Flaring
Gas flaring is defined as “the burning of the gas that comes out of the ground during oil extraction and it is a practice old as oil production itself”. While I can understand that processing of gas at oil facilities is challenging, surely there are better things we can do than to just burn it. Humanity has solved more challenging problems. The article talks in further details behind the motivations for flaring.
Safety Reasons: Dealing with excessive and variable pressures is often part of oil and gas extraction and processing operations and gas flaring helps de-pressurise equipment and reduce the impact of such variation, by combusting the excess gas.
Economic and Technical Reasons: Since oil fields are often located in very remote locations, it can be very difficult from both a logistical and economic perspective to transport associated gas to a place where you process and use it.
Regulatory Reasons: In rare cases, while it might make sense to capture and utilise associated gas, the laws of some countries might forbid or restrict companies’ ability to commercialise that gas. Regulations may also be quite unclear about how associated gas can be utilised commercially, which may create confusion about how such gas can be handled.
Gas Venting
Gas venting refers to “releasing associated gas directly into the atmosphere without combusting the gas”. The article further expands
Venting can take place as a result of several processes relating to oil and gas development such as pipeline and tank repairs, well completion and maintenance, utilisation of natural gas-driven pneumatic pumps, liquids unloading on low-pressure gas wells, among others.
Fugitive Emissions Have a Very High Contribution and It’s Possibly Underestimated
Venting can be thought of as leaks that happen during the process of extracting oil & gas. While it is a crime against humanity that these leaks continue to happen and account for 4.4% (just venting) of total GHG emissions, the even bigger crime against humanity is that these leaks haven’t been measured properly and probably the quanta of leaks is much more than what we are estimating. According this video from bloomberg, according to US EPA’s calculations, the total leaks of an O&G company in Texas were expected to be 0.2-0.3% of total production. But when they actually measured it, it turned out to be 3.5%!!
Fortunately, you have companies like SkyTruth that are focusing on measuring gas flaring and venting accurately using satellite creating maps like the one below. And EPA is also coming up with more regulations putting restrictions on fugitive emissions. But sooo much more needs to be done and at a much faster rate.
Conclusion
In the popular media, whenever people are talking about climate change, the entire focus is on wind, solar, batteries & EVs. One of the main motivations for me to write this post was to understand what are the true sources of all our GHG emissions at a systemic level. And the reality that comes out is a far far more complex one than one that is painted in popular media. Few people talk about the emissions from battery manufacturing. No one talks about how planes, ships and even trucks cannot be decarbonised now. Very few people talk about emissions from manufacturing of Iron & Steel, and even fewer talk about fugitive emissions. In this article, we haven’t even delved into the emissions from agriculture, waste management & other industrial processes, which are a whole another ballgame altogether!!
Through this post, I would like people to appreciate how complex our global economic order is, and how GHG emissions happen from several different kind of sources. Further, I would also like people to appreciate what a gargantuan task of decarbonisation we have on our hands. Our systems are incredibly complex, and there is a massive inertia to change. There are no easy fixes or magic bullets. A very skillful combination of policy levers, market forces, and science & technology innovations would be required to combat all the various facets. Remember that the technology to decarbonise big transportation, manufacturing, agriculture & even cement has not yet been invented. But this also presents a significant opportunity - to be remembered as the generation that accelerated the climate change fightback, when they write the history of this century 200-300 years from now.


